
Average IQ in the World: The Real Global Number May Surprise You
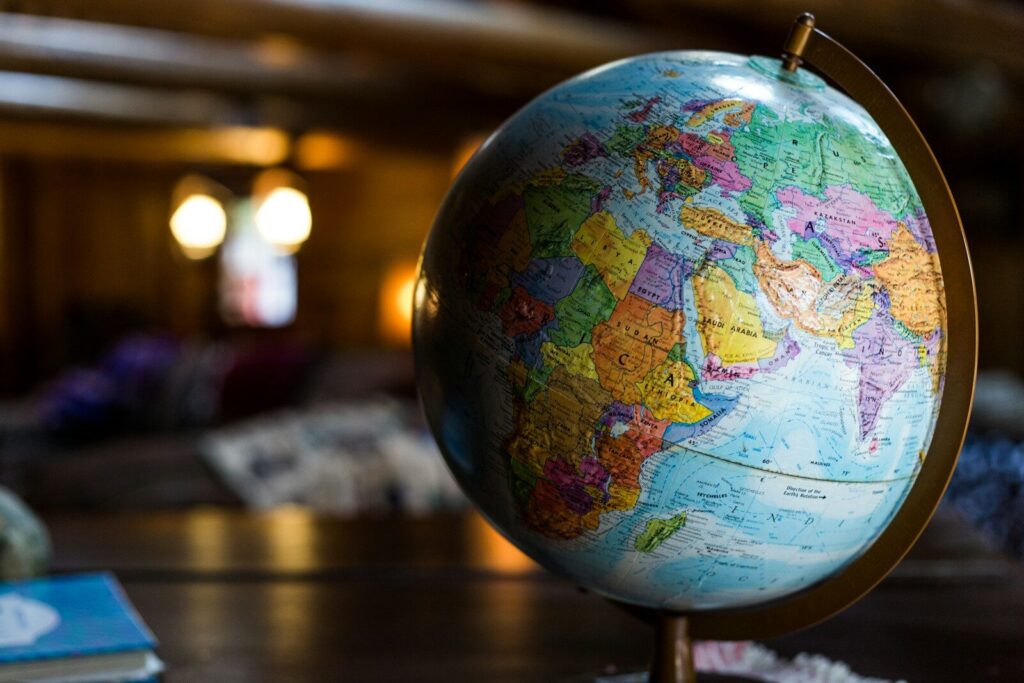
Type average iq in the world into a search box and watch the answers argue.
One page says 100.
Another says about 89.
A third says the question has no real answer at all.
Three answers. One question. Each page sounds sure of itself.
I typed the same question myself one evening, and the fight on the screen is the whole story.
The world holds about 8.2 billion people. Nobody has ever given them all the same test. So where does any single number come from?
This post walks through the answers one by one, and shows which one you can trust.
The short answer is 100, and it is not a measurement
Start with the number you see most. It is 100.
Test makers set it there on purpose. They give a new test to a large group of people first, chosen to mirror the people the test is built for.
Whatever raw score sits in the middle of that group becomes 100. The spread is set so that one standard step equals 15 points.
So 100 is the middle of the group the test was built on. It is not a prize the world won. It is not a grade the human race earned.
About two in three people score between 85 and 115. Scores from 90 to 109 are often called average.
The scores pile up near the middle and thin out at the edges, like a hill. Very high scores and very low scores are both rare. That hill shape is built into the test too. It is the shape the test makers chose when they set the scale.
Think of a clothes shop. A size medium is the middle of the sizes that shop stocks. It is not the middle of every body on Earth.
An IQ test works the same way. On a test built for one country, the average of that country is 100 by design. The world was never the group.
Nobody has ever tested the whole world
The United Nations put the world at about 8.2 billion people in mid-2024.
To know the true world average, you would need to test a fair sample of all of them. Every language. Every age. Every level of schooling. Rich cities and remote villages alike.
No study has ever done that. The biggest school tests reach hundreds of thousands of pupils. That is a lot of children. It is a tiny slice of 8.2 billion people.
Millions of people take free online tests every year. That sounds like a lot of data. It is not a fair sample. The people who choose to take an online test are not the same as the people who never do. A crowd that picks itself cannot stand in for the world.
Most IQ tests were built in one country, in one language, around one school system. The questions lean on the words, pictures and habits of that place.
A question that feels plain in one country can feel strange in another. A test built in one place ends up measuring how close your schooling sits to the test maker’s world.
That gap is widest exactly where the data is thinnest. The countries with the least testing are the ones where the test fits worst.
Where the other number comes from
So where does about 89 come from?
Some pages quote a world average near 89. That figure traces back to a study from 2010 that covered 108 nations. It is an old estimate, built from old parts, and it keeps getting quoted as if it were fresh.
The best known source for country figures is a book. In 2019, Richard Lynn and David Becker published The Intelligence of Nations. Their dataset gives a number for 198 countries and territories.
Here is how they built it. They gathered hundreds of small studies that used IQ tests or school tests in different countries, in different years, on different age groups. Then they averaged the results for each country and scaled them onto one shared scale.
For countries with no study at all, they filled in a number from nearby countries. The dataset marks those numbers as estimates, not measurements.
So the world figure is an average of averages. A patchwork of old studies, mixed tests and filled-in gaps, boiled down to one neat number.
What the critics found
Researchers have picked this dataset apart for years, and the sharpest review came in 2022, from Sear, Lawson, Kaplan and Shenk.
Their point was simple. The studies behind the numbers are too mixed to average into one clean score. Different tests. Different ages. Different ways of picking people. Samples often tiny or lopsided. Gaps filled in from neighbours.
Their count of the problem is worth hearing in full. The dataset gives measured figures for 131 countries and extrapolated figures for 72 more. In 37 out of every 100 samples, fewer than 1,000 people were tested. In 63 out of every 100 samples, only people under 18 were tested. And 30 out of every 100 countries rest on a single sample.
Six countries rest on fewer than 100 people. One of them, Angola, rests on 19.
Nineteen people cannot stand in for a whole country. No honest average can be built from that.
When a number rests on so little, it stops being a measurement. It becomes a guess with a decimal point.
The authors say the dataset is not fit for its purpose, and should not be used to draw conclusions about how intelligence varies around the world.
In June 2024, STAT News reported that researchers had asked journals to retract papers built on Lynn’s data. Two papers have since been pulled, one from 2010 and one from 2020.
Scores move, so any world average would move too
There is one more reason to hold the world number lightly. Scores move.
Across much of the 20th century, raw scores rose by about three points every ten years, in country after country. Psychologists call this the Flynn effect, after James Flynn, who documented it in the 1980s.
Genes did not change in a hundred years. Food, schooling and daily life did.
Because raw scores kept rising, test makers had to reset their scales again and again, so the average stayed at 100.
That means a world average from 2010 would not match one from 2025, even if the method were perfect. The people under the label moved. The label stayed still.
If you want to compare countries, use a test that was built for the job. PISA is run by the OECD. It tests 15-year-olds in reading, maths and science, with the same method in every country. In 2022, about 690,000 students took it in 81 countries and economies.
It tests school learning, not IQ. It says so. That honesty is the point.
Singapore led all three subjects in 2022. Maths 575. Reading 543. Science 561.
But PISA still only tells you about schools and 15-year-olds. Not about the fixed brainpower of a whole planet.
Wrapping up: ask for the ruler, not the number
The next time a single world number pops up in your feed, pause for ten seconds.
Ask who was tested, and when. Ask which scale made the number. Ask whether it is a fresh measurement or an old estimate wearing new clothes.
A single global number sounds neat. Neat is not the same as true.
The world is too big, too varied and too fast-moving for one number to hold it.
That is not a failure of the tests. It is the truth about the question.